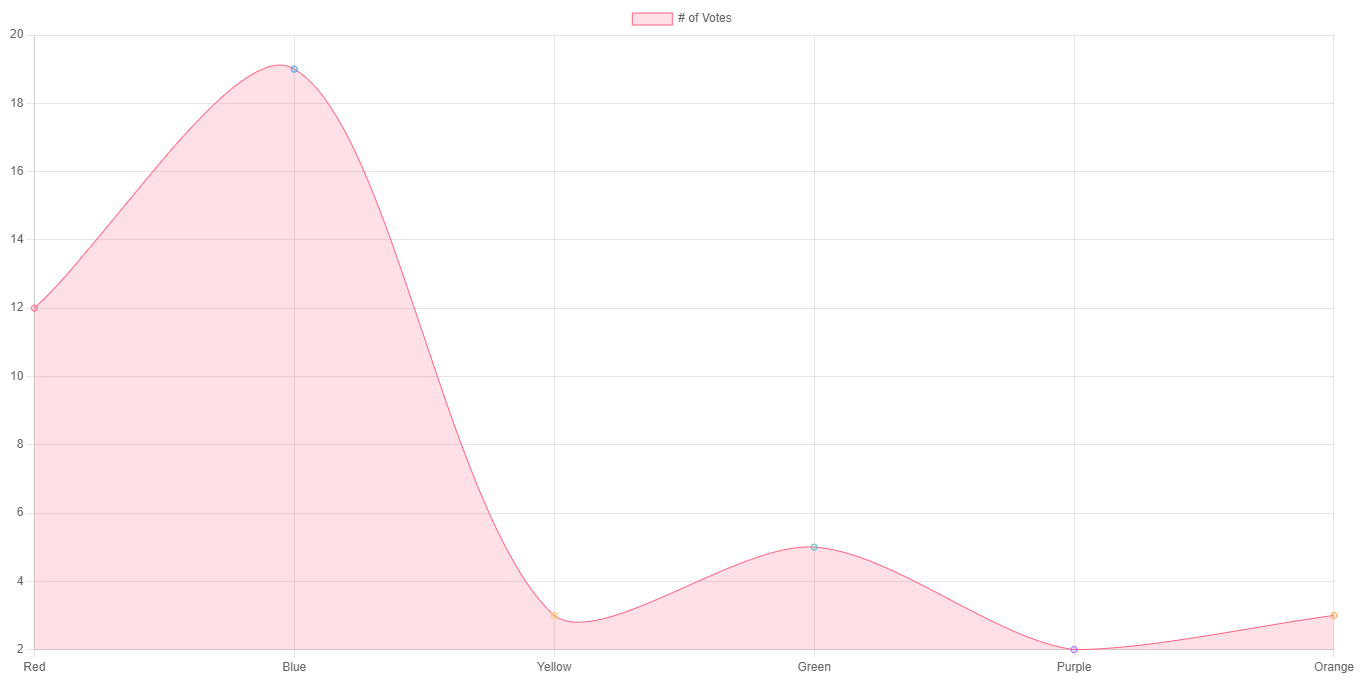
로컬에서 chart.js 를 사용하여 chart를 그리는 방법이다.
자바스크립트를 해석해야 해서 크롬엔진이 탑재된 구글 크롬이 필요하다.
필요 한거
1. 구글 크롬
2. chart.js 파일(온라인 상태이라면 cdn에 연결해 사용할 수 도 있다.
3. moment.js 시간축을 사용한다면 이것도 필요하다.
chart.min.js 가 필요함.
기존 버전에서는 빌드된 버전을 제공하였으나, 현재는 제공하지 않음.
https://www.chartjs.org/dist/master/chart.min.js 사이트에서 다운로드 받을 수 있음.
https://www.chartjs.org/dist/master/chart.js 는 시간 축 기능을 위해 Chart.js 전에 Moment.js를 포함해야 한다.
아 어렵다.
html 코드
<html lang="en">
  <head>
    <meta charset="UTF-8" />
    <meta http-equiv="X-UA-Compatible" content="IE=edge" />
    <meta name="viewport" content="width=device-width, initial-scale=1.0" />
    <title>Document</title>
    <script src="./js/chartjs/chart.min.js"></script>
  </head>
  <body>
    <div>
      <canvas id="myChart" width="200" height="100"></canvas>
    </div>
    <script src="./js/line-chart.js"></script>
  </body>
</html>
이 코드에서는 chart.min.js를 사용했다.
참조 : https://www.chartjs.org/docs/latest/getting-started/usage.html
Usage | Chart.js
Usage Chart.js can be used with ES6 modules, plain JavaScript, and module loaders. Creating a Chart To create a chart, we need to instantiate the Chart class. To do this, we need to pass in the node, jQuery instance, or 2d context of the canvas of where we
www.chartjs.org
한글화 : https://yeon22.github.io/Chartjs-kr/docs/latest/getting-started/installation.html
설치 · Chart.js 문서
results matching "" No results matching ""
yeon22.github.io
'프로그래밍' 카테고리의 다른 글
| DB] DB 정보, 크기 가져오기 (0) | 2022.05.04 |
|---|---|
| DB] Connection string for DB using ODBC (0) | 2022.04.21 |
| [툴] VSCode - emmet 안될때 (0) | 2022.01.19 |
| FFT Analysis 문제점 (0) | 2020.09.09 |
| [참고]FFT (0) | 2020.09.08 |


